A complete guide to cat nutrition: what cats eat in the wild, choosing wet vs. dry food, reading labels, safe human treats, foods to avoid, how much to feed,...
Articolo
•
Designer Mixes
Cat Food Testing Finds Heavy Metals and Plastic Chemicals Across Popular Brands

Shari Shidate
Collaboratore di Designer Mixes
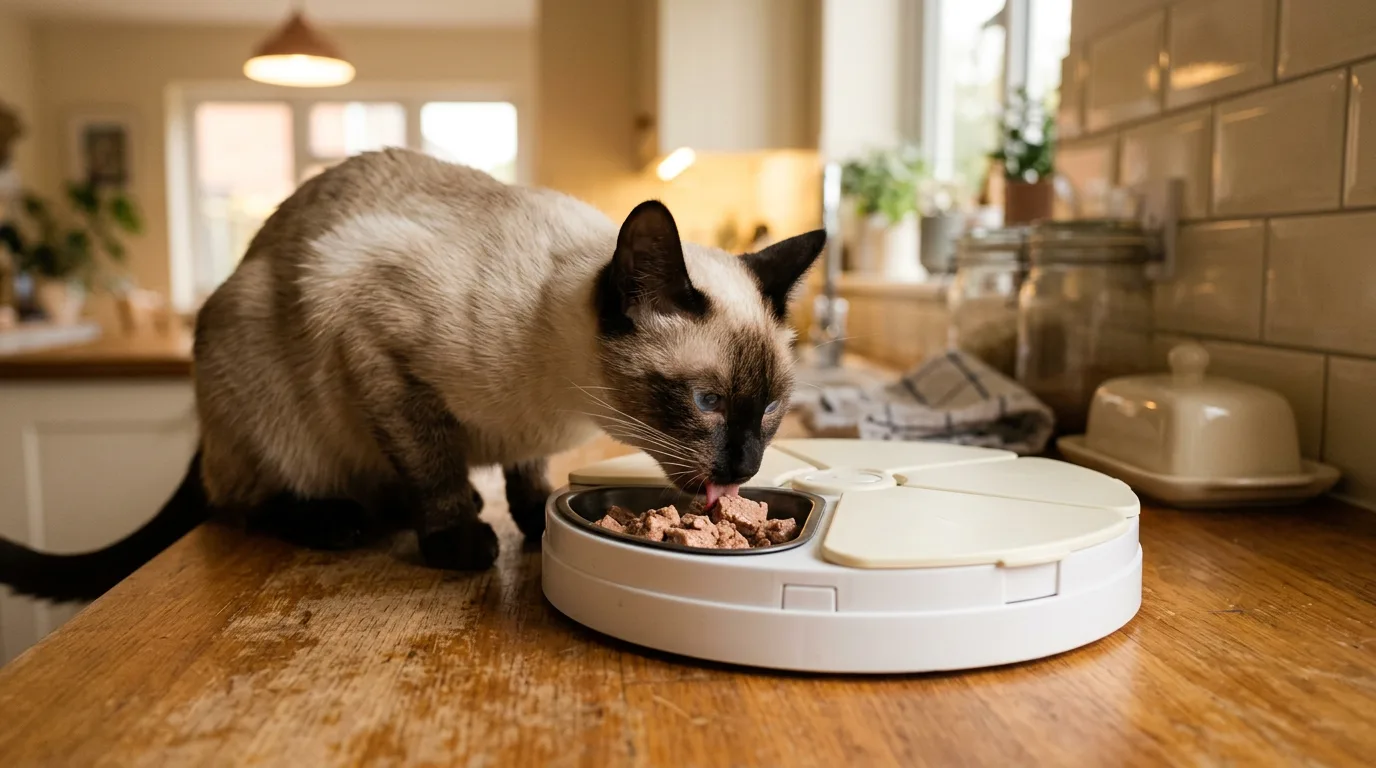
Cats are creatures of habit. Many eat the same food every day for years. That consistency can make nutrition simpler, but it also means whatever is in the bowl can become a steady source of exposure over a lifetime.
In testing of 100 cat food products across 62 brands, heavy metals were nearly universal. Lead was detected in 99% of products, cadmium in 96%, and arsenic in 94%. In a category where metals show up almost everywhere, the bigger question is not “Is there anything in cat food?” The question is which products and patterns tend to run higher, and what practical steps can help owners choose with clearer eyes.
What was tested
The lab work looked at 100 cat food products from 62 brands across three formats: dry (n=31), wet (n=40), and air-dried or freeze-dried (n=29). Testing was performed by an independent analytical chemistry laboratory with ISO 17025 accreditation.
In total, the project evaluated the foods for more than 122 environmental contaminants and toxins. The list included heavy metals (arsenic, cadmium, lead, mercury), plus chemicals associated with processing, pesticides, and packaging, including glyphosate and phthalates such as DEHP.
One detail that matters for interpreting the results: contaminant levels were expressed per 1,000 kilocalories, not per kilogram of food. This was done because cat foods vary widely in calorie density. The products ranged from 547 to 5,290 kcal/kg, and wet food is roughly a quarter as calorie-dense as dry, largely because it contains much more water. A cat eating wet food must consume about four times the weight of food to get the same calories. If foods are compared only per pound, wet food can look cleaner simply because it is diluted by water, not necessarily because the ingredients are purer.
What they found
Heavy metals showed up in the vast majority of tested products:
- Lead was detected in 99% of products.
- Cadmium was detected in 96% of products.
- Arsenic was detected in 94% of products.
Because these metals are so common, the meaningful difference becomes how high or low a product ranks compared with others.
For lead, the products with the highest levels had about 3.5x more lead than the typical product. Even when a contaminant is common, some foods can still be a much bigger source of exposure than others.
Protein mattered most
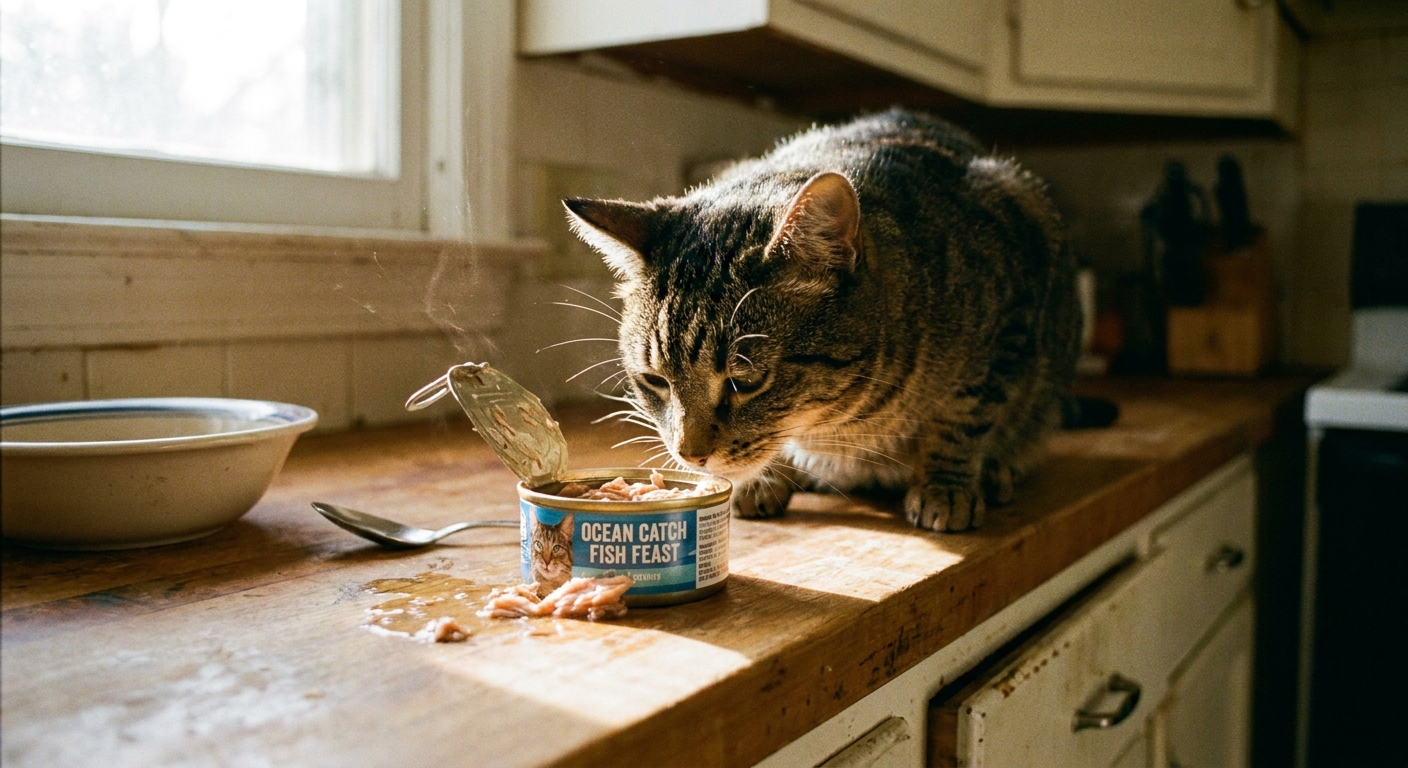
One of the clearest takeaways was that protein source predicted contamination patterns more strongly than whether a food was wet or dry.
Fish and mercury
Fish and seafood recipes stood out for mercury. After accounting for whether a product was wet or dry, fish and seafood products had about 18x more mercury than foods made with other proteins.
When only wet foods were compared, fish-based wet products had about 28x as much mercury as wet foods made with other proteins.
Nearly 48.6% of fish and seafood products ranked among the highest for mercury levels, while no poultry-based products did.
There is also a nuance worth knowing: products that did not have fish in the name but still contained a marine ingredient still tended to have more mercury than products with no marine ingredients. For owners trying to pay closer attention to fish, the product name alone may not tell the full story.
Fish and cadmium
Cadmium also appeared more concentrated in fish-based diets, with fish-based products coming in at about 2.5x the level found in other products.
Poultry met the benchmark more often
When the foods were evaluated against Clean Label Project’s standard, 84.8% of poultry products met it. For fish and seafood products, only 25.7% met the same standard. That is a 59.1 percentage-point gap, meaning poultry products were 3.3x as likely to meet the standard.
This internal purity benchmark is used to compare products within the category. The most useful takeaway for everyday shopping is the pattern itself: in this testing, fish and seafood recipes were much more likely to land higher for mercury.
Wet vs. dry
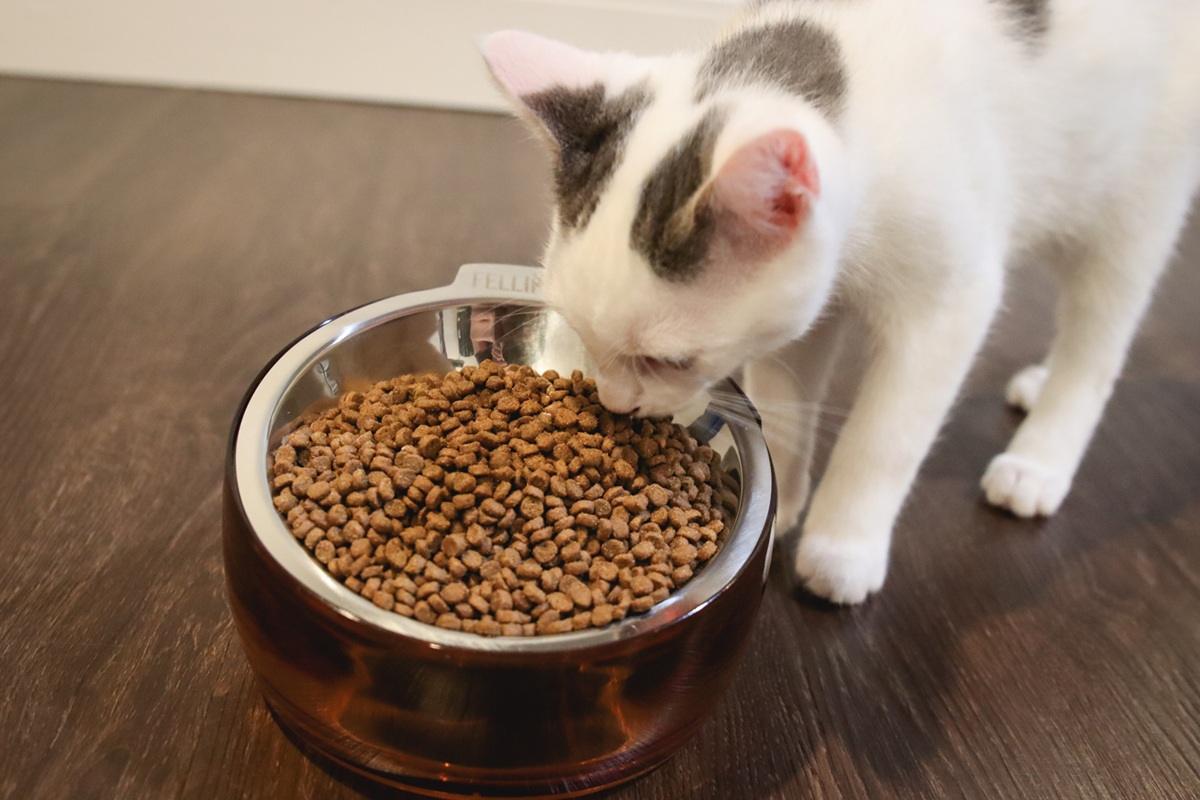
Format was less important overall than protein source, and the formats were within one percentage point of each other on meeting the same benchmark. But lead showed a notable pattern: dry food had about 3x more lead than wet or air-dried food after accounting for calories. This difference remained even after considering protein source.
Unlike mercury, lead did not tie neatly to one ingredient type in the analysis. The format effect suggests that the format of the food, not a particular ingredient examined, may play a role in where lead levels land.
Glyphosate and plant load
Glyphosate was detected at measurable levels in 37% of products. Its breakdown product, AMPA, was found in 12%.
The clearest relationship here was with plant ingredients. On average, glyphosate levels increased by about 40% for each additional plant ingredient appearing among the first ten ingredients on the label. In other words, it was not only about whether a food had plants. It was about how many plant ingredients were used in the recipe.
Plastic-related chemicals
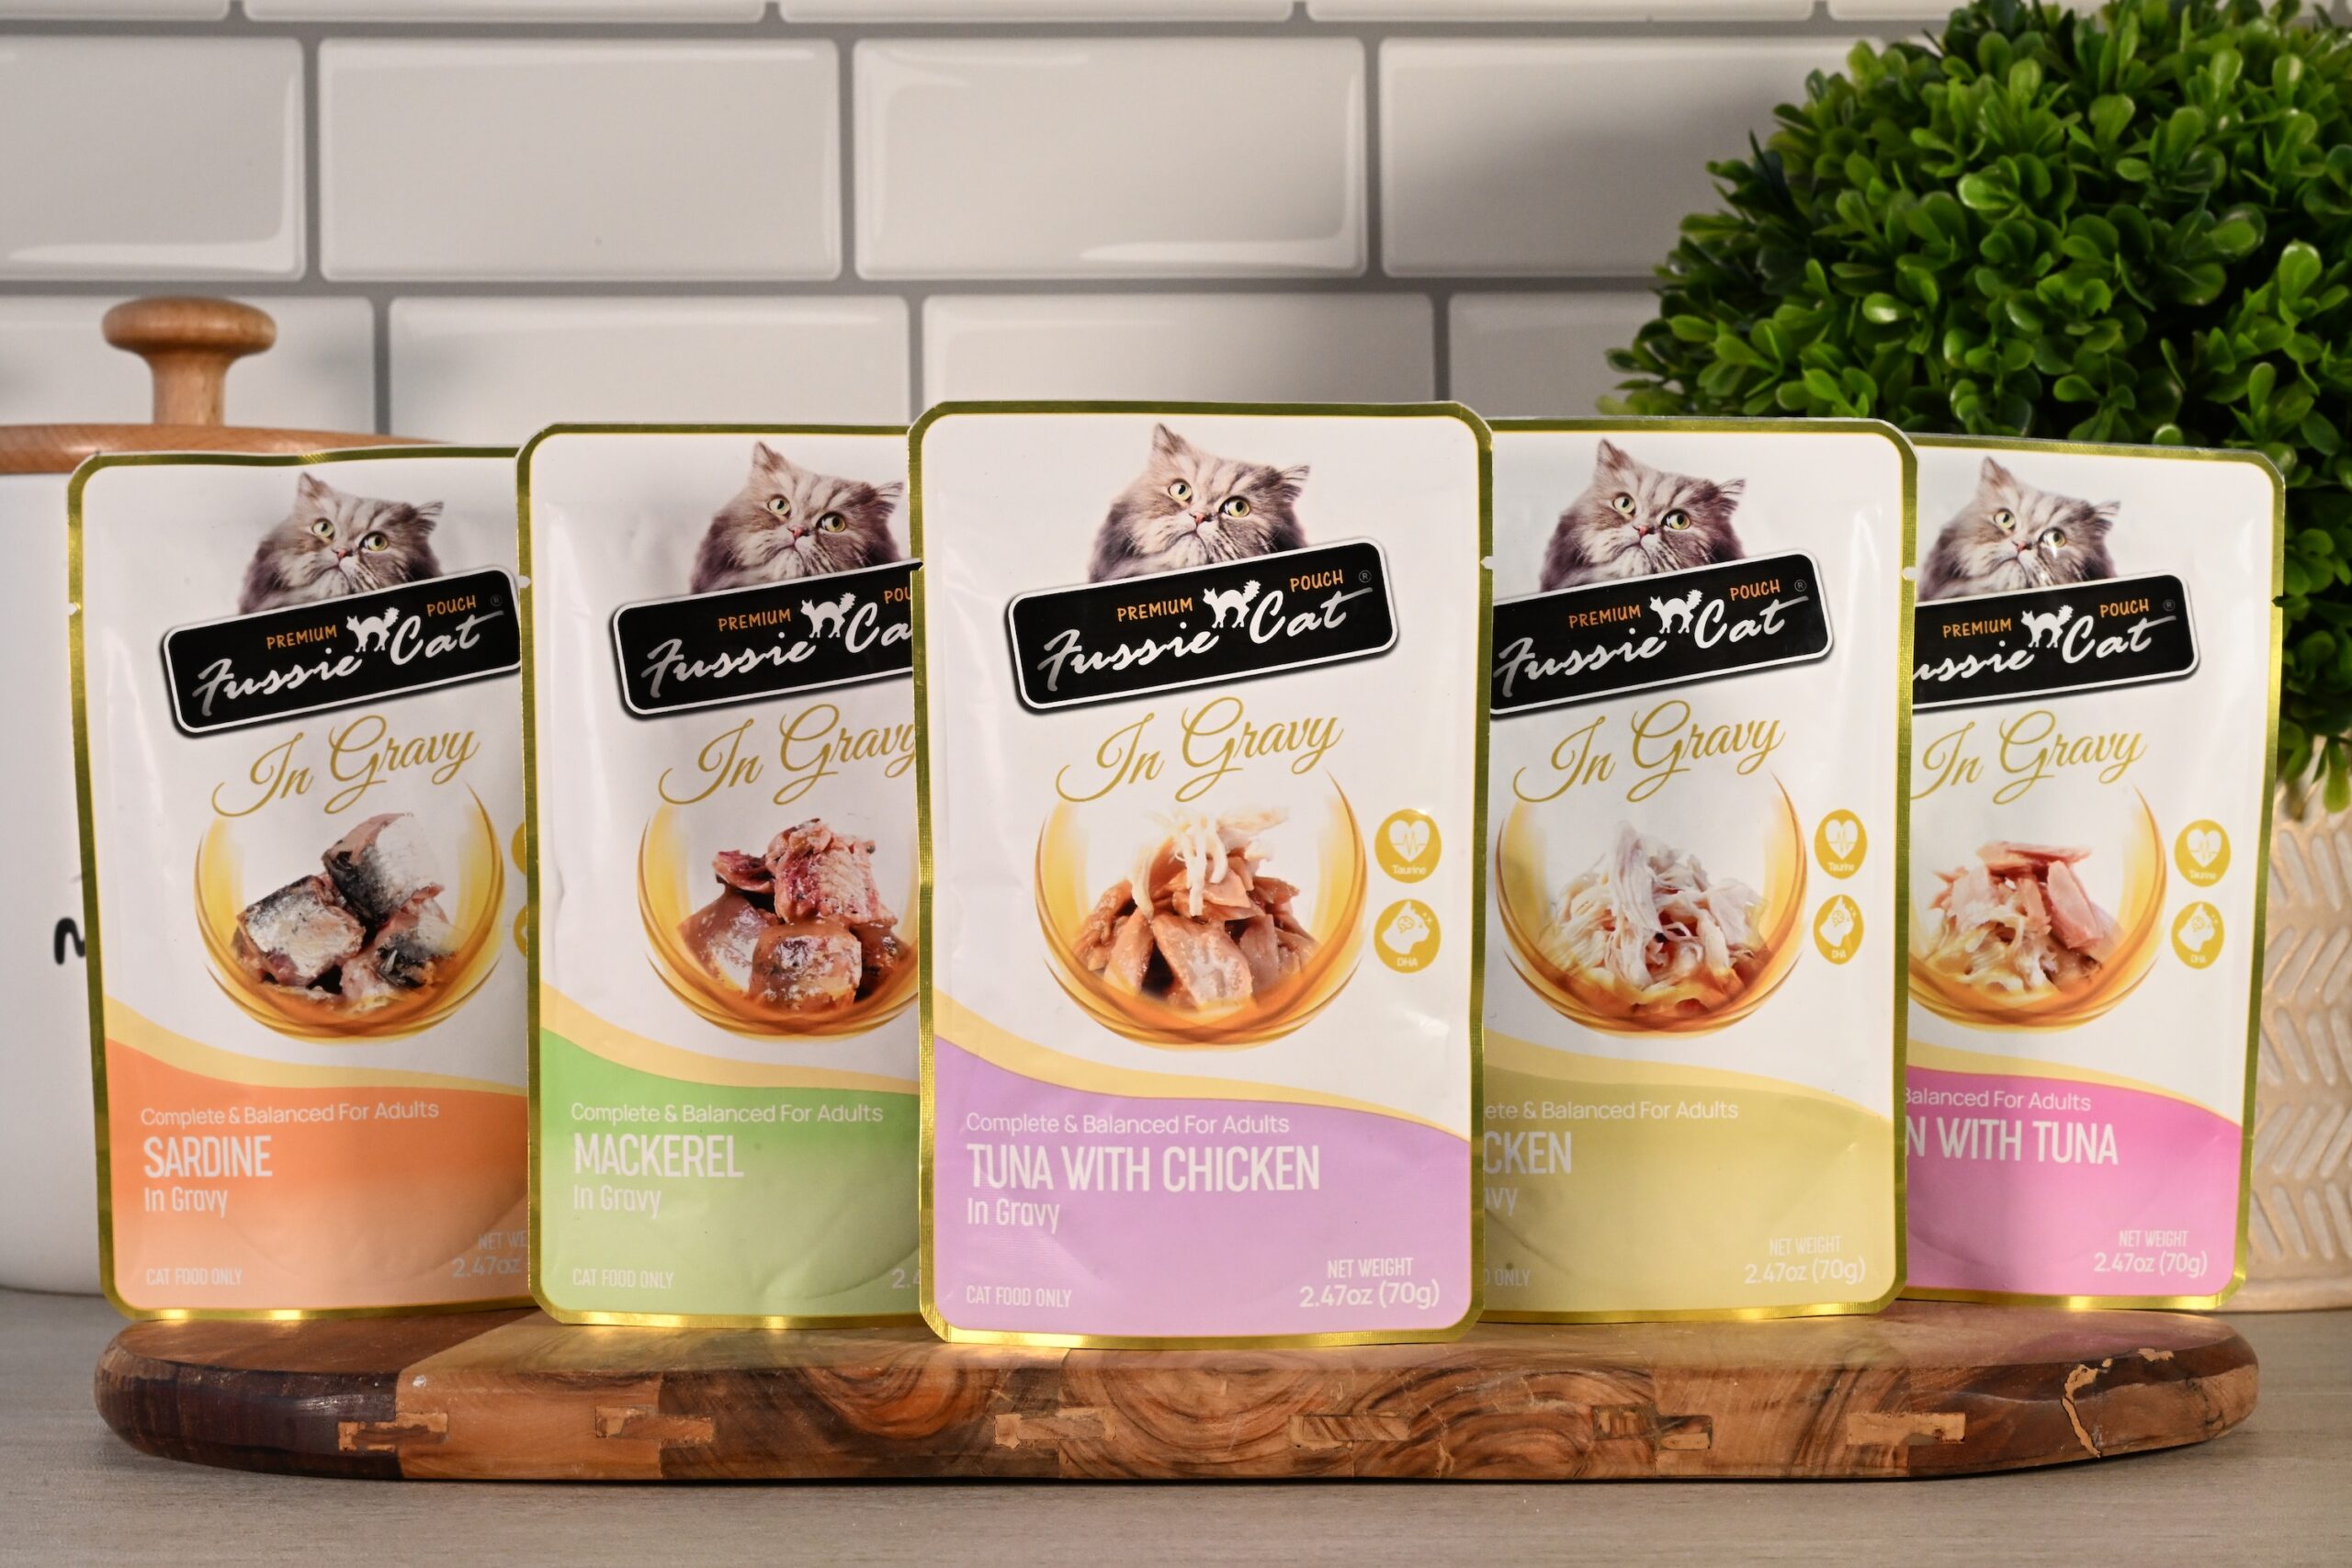
Testing also looked for packaging-related chemicals. A standout was DEHP (bis(2-ethylhexyl) phthalate), a phthalate linked to hormone disruption. DEHP was detected in 48 of 100 products.
DEHP showed up at similar rates in different types of cat food, but when it was present, packaging type mattered: canned and pouched products carried about five times as much DEHP as bagged products.
Bisphenols were uncommon in this set. BPA showed up in two products and BPS in one product.
Heat-process chemicals
Acrylamide, a chemical that can form during high-heat cooking, was found at measurable levels in 4 of 100 products, and at very low levels in an additional 24 products.
Premium is not a guarantee
Many cat owners assume a higher price or a cleaner ingredient label means a cleaner product. The clearest signals in this testing were not about branding. They were tied to measurable patterns linked to protein source, format, and ingredient makeup, like how plant-heavy the top of the label was.
Why the first ingredient can mislead
A lot of shoppers rely on the first ingredient as the main truth of the food. But ingredient lists are ordered by weight, and recipes can include multiple versions of the same crop. In this dataset, the first-listed ingredient did not reliably reflect what dominated the top of the ingredient list.
In 35 of 100 products, the first ingredient belonged to a different category than the category that appeared most often among the first ten ingredients. The analysis described a common industry tactic called ingredient splitting, where one plant may appear multiple times in different forms, for example, a protein and a flour. This is allowed, and sometimes it is functional. But it can also make the headline ingredient feel more prominent than it really is.
Another association in the findings: products where the first ingredient was outnumbered by other plant ingredients among the top ten tended to have higher levels of lead.
More data on key ingredients
By combining the results of the current study with prior cat food testing, the dataset expands to 541 samples across 87 brands. That larger pool is enough to examine which individual ingredients are associated with higher heavy metal levels.
Most of the most problematic ingredients in this analysis came from the sea. Herring meal, tuna, and fish broth were most strongly associated with contamination.
- Products containing herring meal ranked among the most contaminated 10% of products 60% of the time, roughly 17 times more often than would be expected by chance alone.
- This contamination risk was driven by the heavy metals mercury, arsenic, and cadmium.
- Lead was not strongly associated with marine ingredients in this analysis, suggesting it may be coming from other sources.
One non-marine ingredient also stood out: turmeric ranked fourth, a pattern described as unsurprising given the ingredient’s documented history of lead adulteration, possibly stemming from lead-contaminated coloring agents.
Where contaminants come from
These substances are not being added to cat food on purpose. They enter the system through familiar routes:
- Heavy metals are carcinogens and neurotoxins that occur naturally in soil and water and enter cat food through both plant and animal ingredients. In this testing, mercury and cadmium were most closely linked to marine ingredients.
- Lead showed a different pattern, with higher levels in dry food that were not tied to any one ingredient type.
- Glyphosate was associated with plant-based ingredients.
- DEHP and bisphenols were linked to packaging and food contact materials, and the near absence of bisphenols reflects meaningful changes in packaging practices across the industry.
What cat owners can do
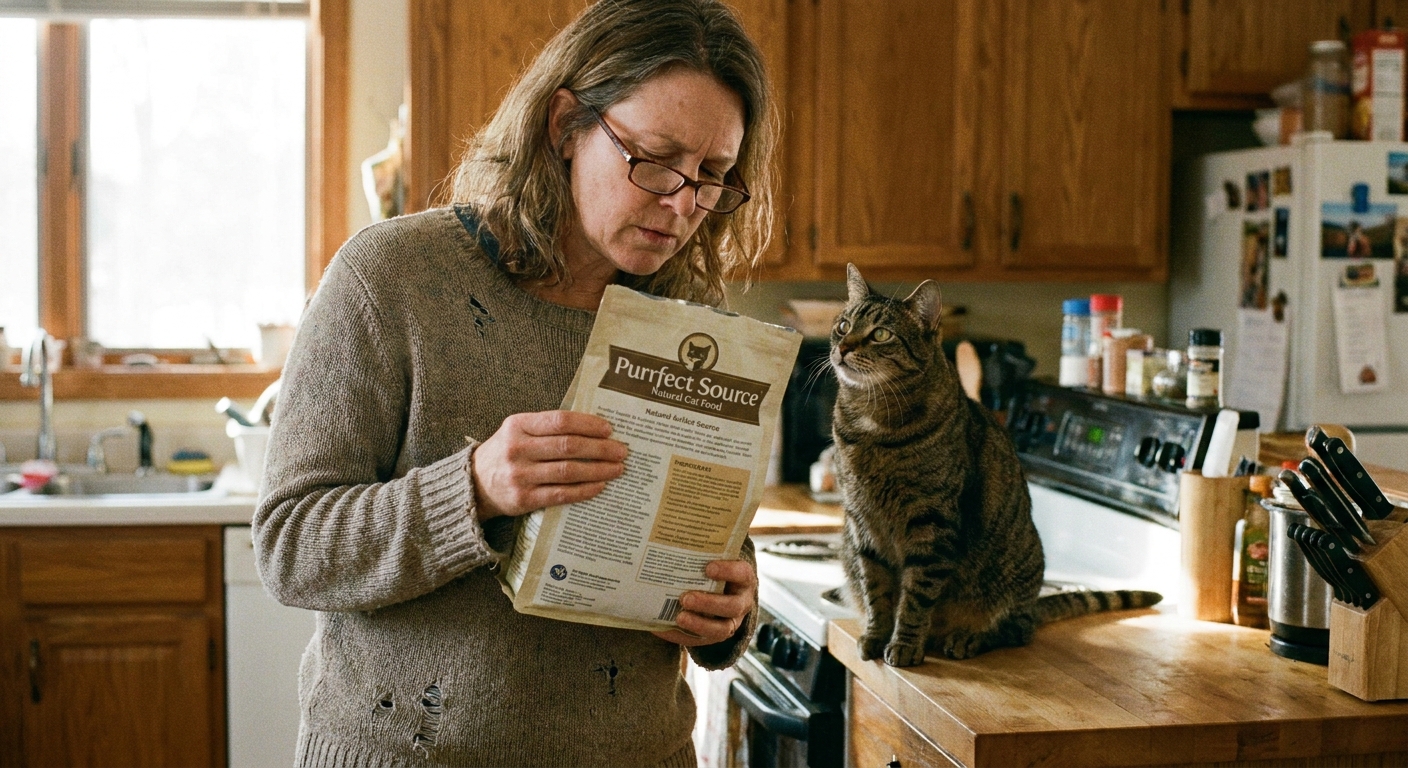
The most useful shopping moves are the ones that follow the patterns in the testing. This is less about a single can and more about what happens when cats eat the same foods every day for their entire lives.
1) If seafood is the default, mix it up
Fish and seafood recipes were associated with much higher mercury on average in this testing. One practical way to use that information is to feed fish-based recipes less often and lean on other proteins more, when a cat does well with them.
2) Watch for marine ingredients beyond the name
Foods that did not have fish in the name but still contained a marine ingredient tended to have more mercury than products with no marine ingredients. If reducing mercury exposure is a priority, the ingredient list matters more than the front-of-pack flavor name.
3) Scan the first ten ingredients for plant load
More plant ingredients in the first ten were associated with higher glyphosate levels. In this analysis, the count of plant ingredients mattered more than whether one appears first or fifth.
4) Do not reduce the decision to wet vs. dry
The results were mixed. Dry foods ran higher for lead, about 3x, while wet foods can look artificially cleaner if comparisons are not corrected for calories. If comparing foods, keep the per-1,000-kcal framing in mind.
5) Pay attention to specific ingredients that flagged higher
In the expanded dataset of 541 samples, products containing herring meal landed in the most contaminated 10% of products 60% of the time. Tuna and fish broth were also strongly associated with contamination. A non-marine standout, turmeric, ranked fourth in association with higher heavy metals.
6) Ask a veterinarian about kidney health
Cats’ kidneys carry the long-term burden of metal accumulation, and chronic kidney disease is among the most common causes of death in older cats. For cats with kidney concerns already on the radar, these findings are a reasonable topic to bring to a veterinarian.
Bottom line
It is unsettling to hear lead, mercury, glyphosate, and plastic chemicals in the same sentence as cat food. The most useful message is also empowering: there were major differences between products, and some of the biggest drivers were visible to shoppers, like protein source, format, and ingredient patterns near the top of the label.
If there is one realistic change to start with, consider whether seafood flavors have quietly become the default. This testing found a strong association between fish and higher mercury, and the expanded dataset also highlights specific ingredients, especially herring meal, that were strongly associated with higher contamination rankings.
Quick FAQ
Were contaminants found only in one type of cat food?
No. The testing detected contaminants across wet, dry, and air-dried or freeze-dried formats.
Which protein stood out most?
Fish and seafood products stood out most strongly for mercury, with about 18x higher mercury than non-fish products after accounting for wet vs. dry.
Does the first ingredient guarantee what the food is mostly made of?
Not always. In 35 of 100 products, the first-listed ingredient category was outnumbered by another ingredient category within the first ten ingredients, a pattern consistent with ingredient splitting.